Explainer
Selling earnings options the day before expiry
On 599 reports whose options expired the next day, insurance sold the evening before came out clearly ahead only on the richest fifth. How we measured it.
On the same reports, under the same rule, only the richest fifth by our richness reading came out clearly ahead. Below is what that claim measures and how we measured it.
The expensive part is buying it back
Before an earnings report, options on the stock get expensive. They work like insurance on a big move, and everyone wants cover for the news. Selling that insurance means collecting its price up front and paying out whatever the stock’s move turns out to be worth.
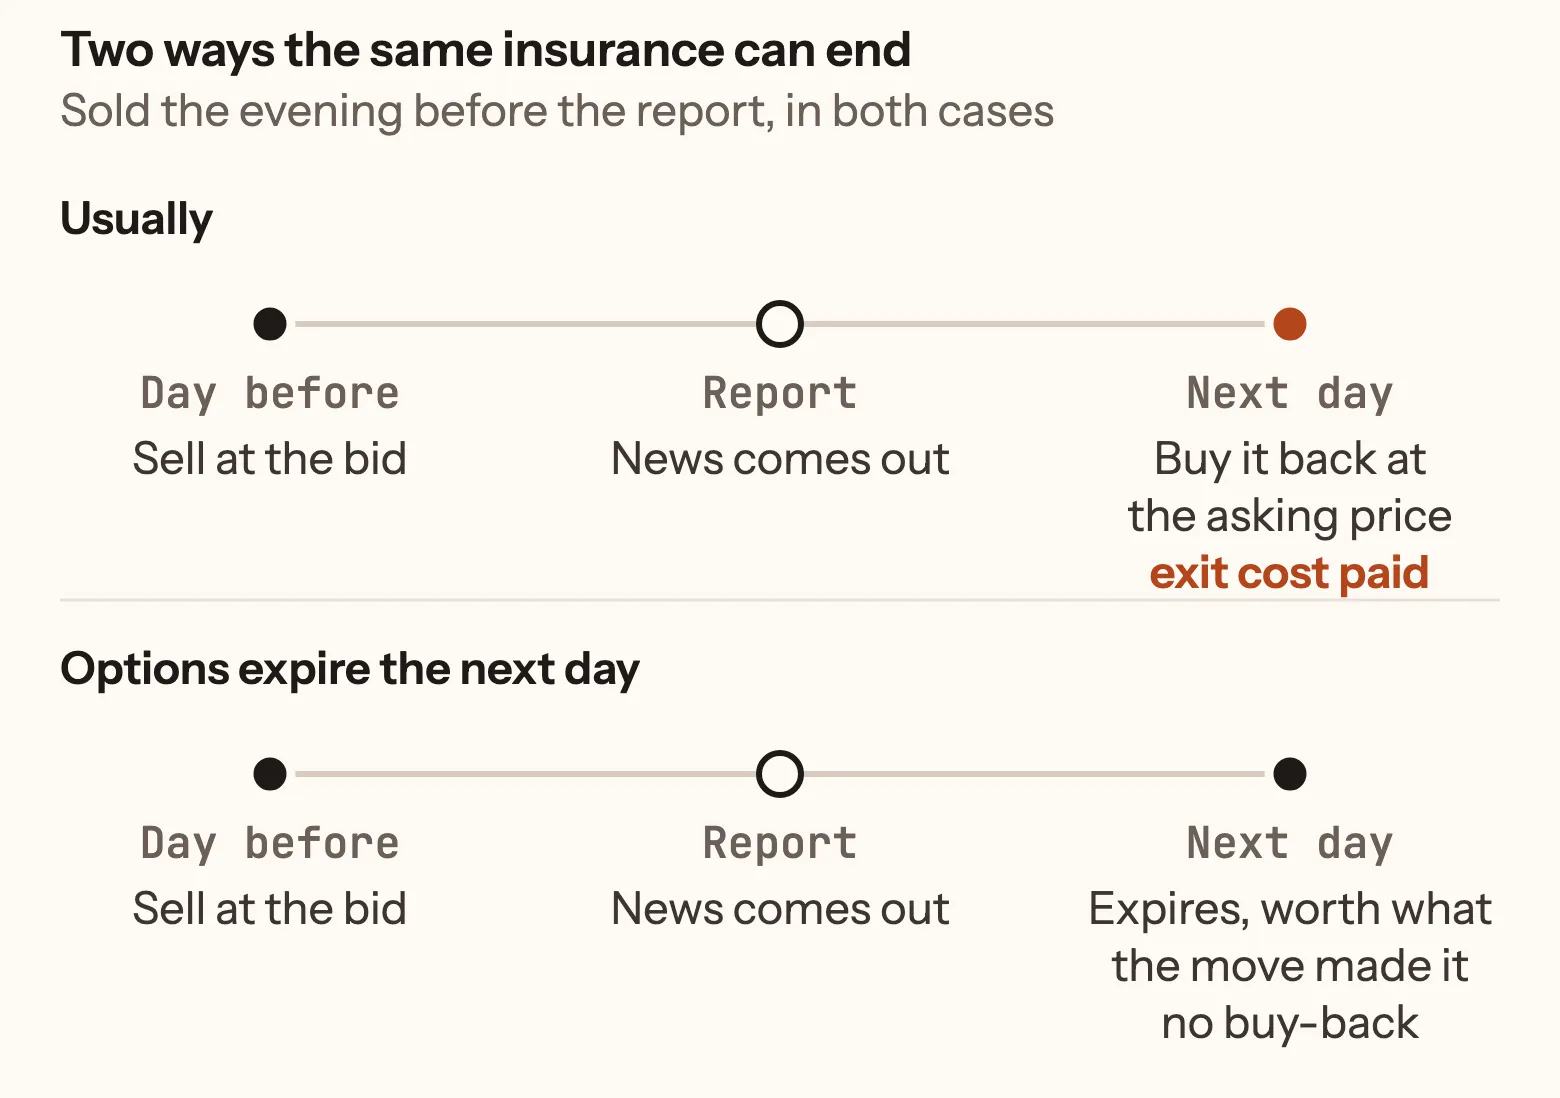
Usually the seller buys the insurance back the morning after the report, once the news is out and its implied volatility, the rate options charge for movement, has collapsed. That exit costs money: you buy at the asking price, which sits above the fair price, and on the morning after a report the gap can be wide. Across most of what we have measured, that exit cost is larger than anything a reading can add.
Some companies report the day before their options expire. Insurance sold on one of those never has to be bought back. It runs to expiry the next day and is worth exactly what the stock’s move made it worth, so the exit cost is never paid. There have been 599 such reports since November 2024, across 245 companies and 104 report days. They are the only reports in this example.
What the richness reading is
For every upcoming report, we take the move the market is pricing in, strip out the stock’s ordinary day-to-day movement, and compare what is left with this same company’s own past reports. The result is a percentile, defined in full in the richness section of the methodology. A reading of 90 means today’s report is priced richer than 90% of the company’s earlier ones; a reading of 10 means it is priced cheaper than all but 10%.
The reading compares a company with itself, never with other companies. It says nothing about which way the stock will go. The board shows it for every company reporting in the next 14 days. A free account opens today’s rows; the rest of the fortnight is what a subscription adds.
We split the 599 reports three ways: the rich fifth, 171 reports whose reading was 80 or above; the cheap fifth, 138 reports at 20 or below; and no picking, all 599 whatever the reading said.
What we measured
For each report, we took the price of the insurance at the bid, which is what a seller would actually receive, just before the close on the last trading day before the report. Then we let it run to expiry and charged the seller what it was worth at the next day’s close. The result for each report is what was collected minus what was paid out, as a share of the stock’s price on that same evening, so a large company and a small one count the same.
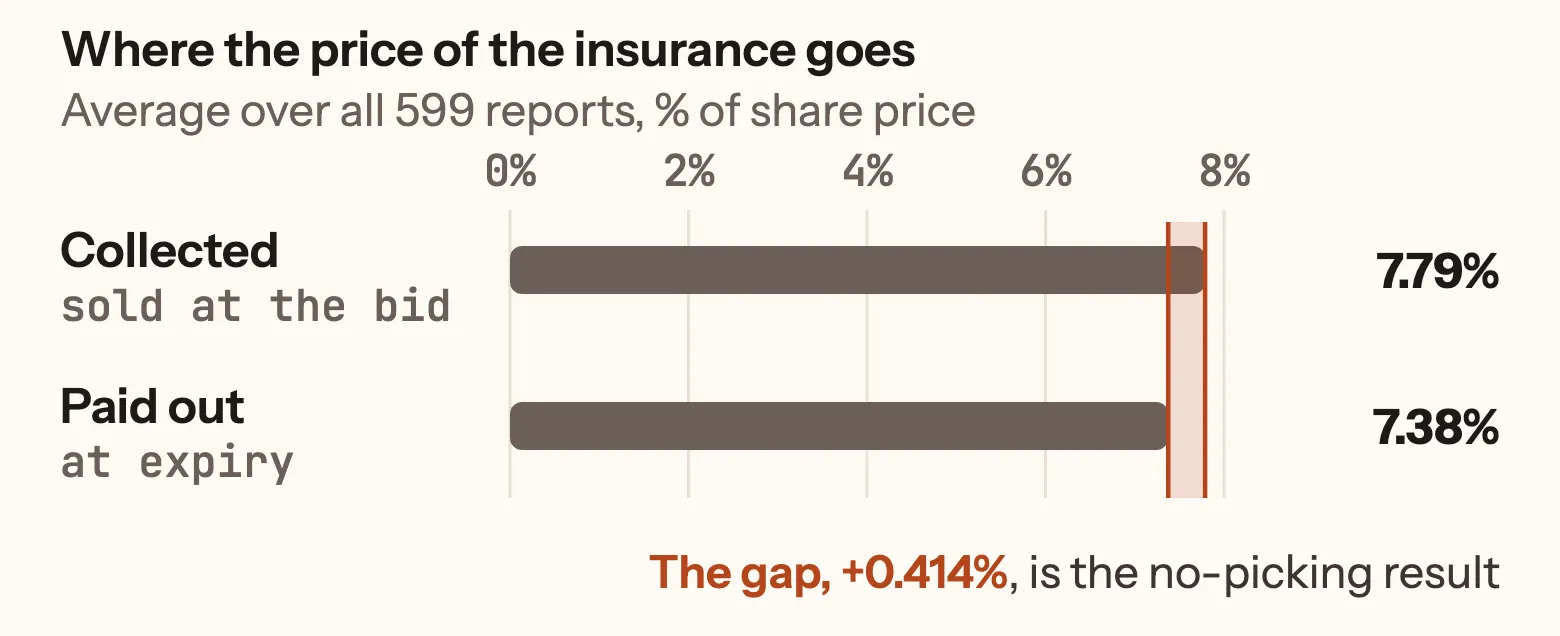
Across all 599 reports, the insurance sold for 7.79% of the share price on average and paid out 7.38%. The result is the difference.
The three results
| Group | Reports | Average result | Likely range |
|---|---|---|---|
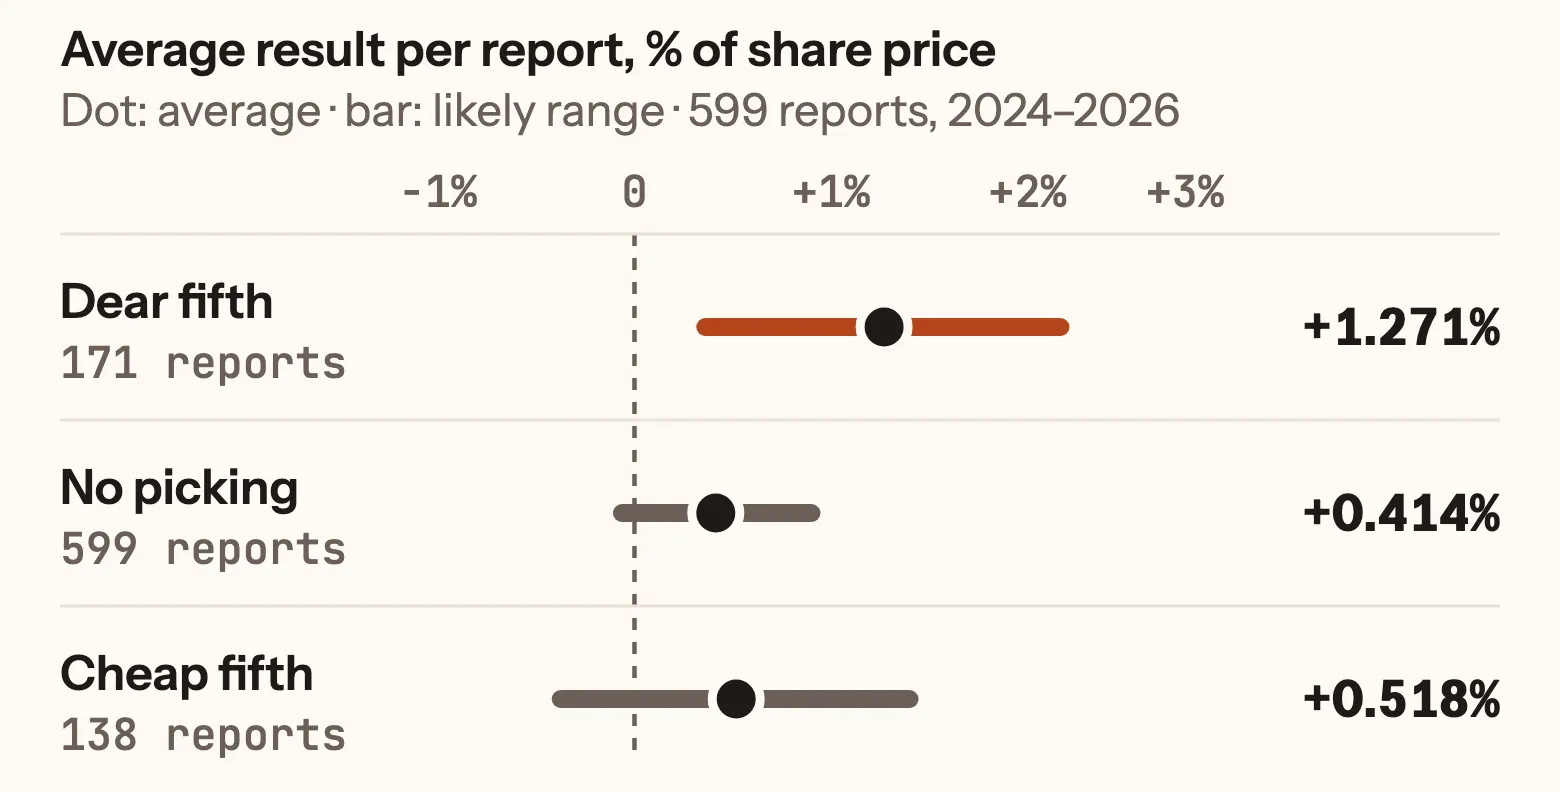
| Rich fifth | 171 | +1.271% | +0.32% to +2.21% |
| No picking | 599 | +0.414% | −0.11% to +0.95% |
| Cheap fifth | 138 | +0.518% | −0.42% to +1.45% |
The average is the result per report. The likely range is how far that average could plausibly be off, given how few reports there are and how much they vary.
“Clearly ahead” means that the rich fifth’s whole range sits above zero. The no-picking range and the cheap fifth’s range both cross zero, so for those two we cannot rule out that the true average is nothing at all.
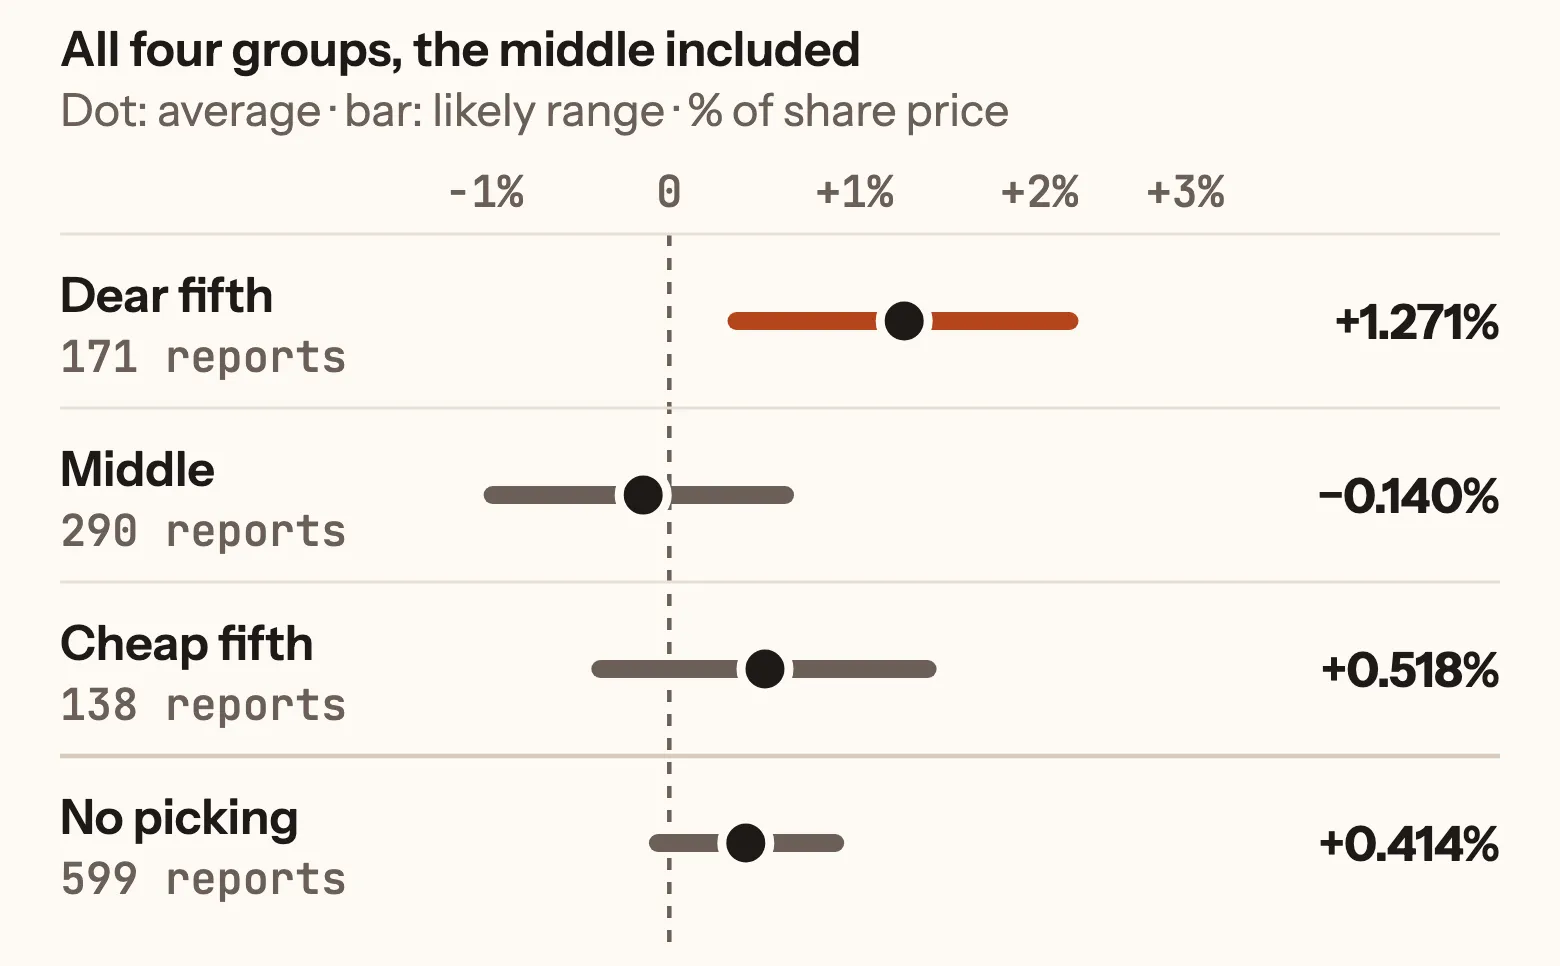
The cheap fifth’s average is a little above no picking’s, because the reports in neither fifth, the middle 290, averaged −0.140% and pull the no-picking figure down. Neither of those two ranges clears zero, so the order between them says little.
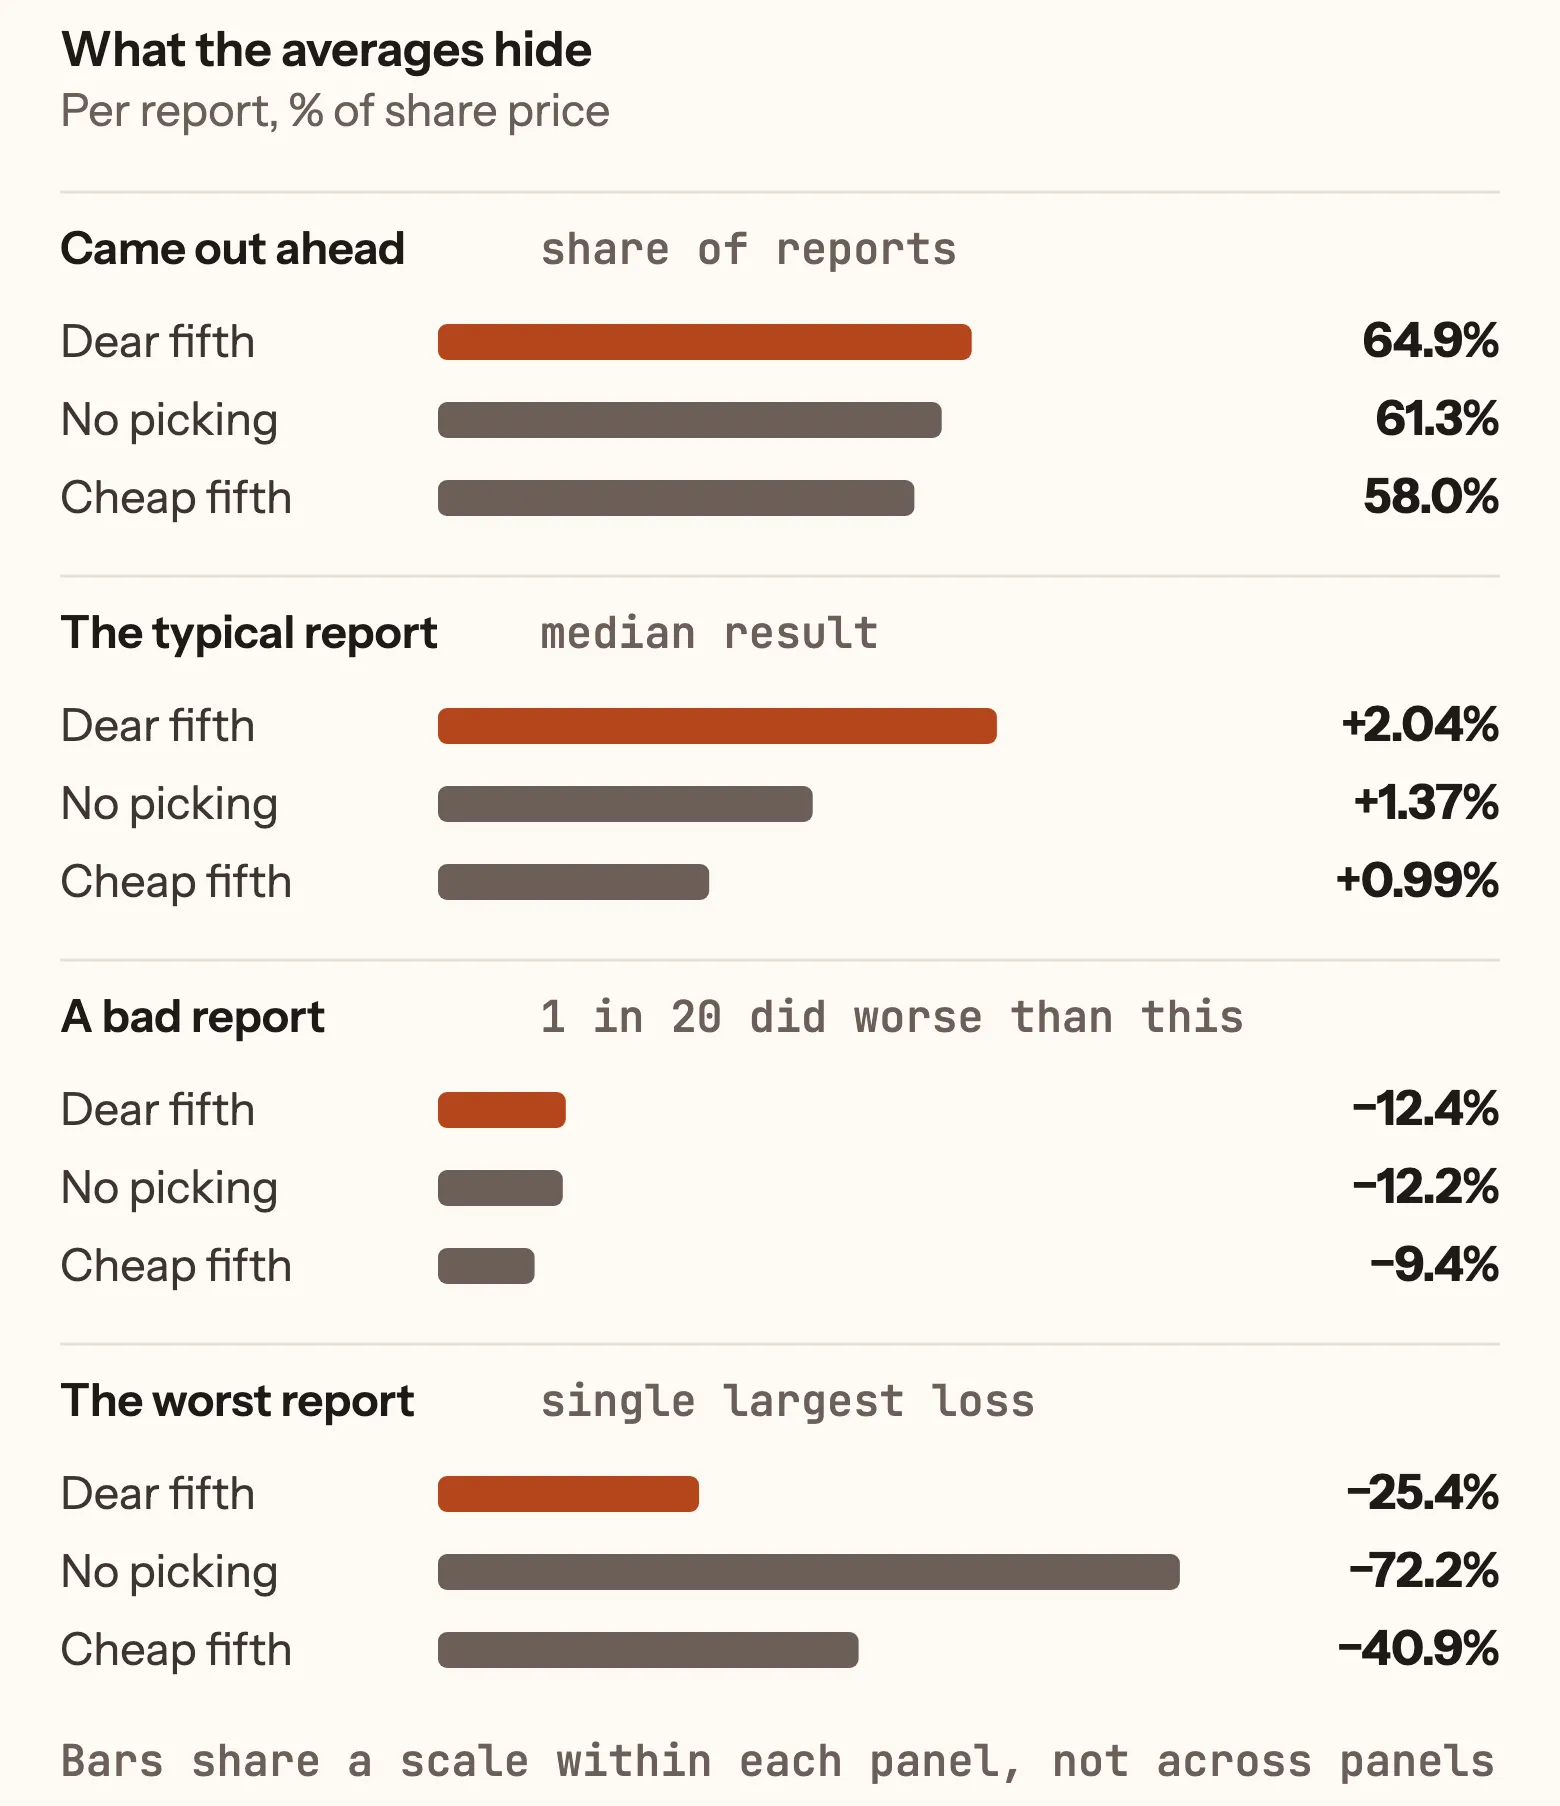
Averages also hide the bad days. With no picking, 61.3% of reports came out ahead, and the worst lost 72.2% of the share price. In the rich fifth, 64.9% came out ahead, and the worst lost 25.4%.
The typical report did better than the average in every group, because a few large losses pull each average down. Picking the rich fifth did not make the bad reports milder, though: one report in twenty lost more than 12.4% of the share price in the rich fifth, against 12.2% with no picking.
Why the bid, not the mid
We priced each sale at the bid because that is what a seller gets by selling straight away. The mid, halfway between the bid and the asking price, is the price usually quoted, but nobody is offering to buy at it. A patient seller may get filled somewhere between the two.
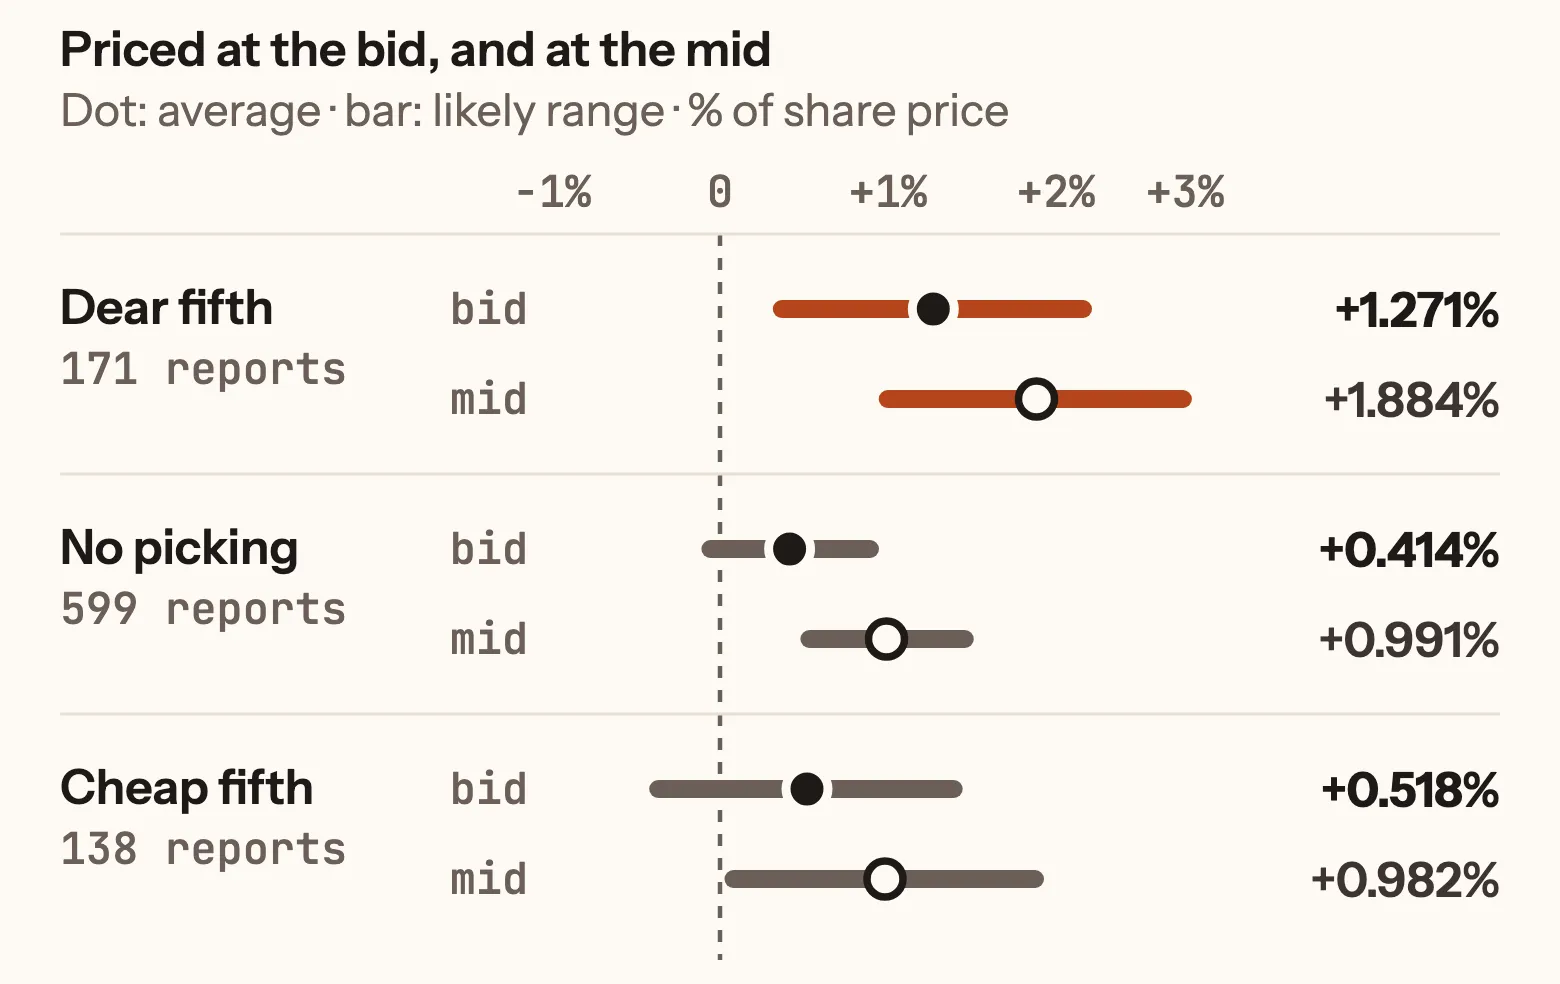
Pricing the same sales at the mid adds that gap back to every report, 0.576% of the share price on average across all 599. Here are the same three groups both ways, over the same reports:
| Group | Priced at | Average result | Likely range |
|---|---|---|---|
| Rich fifth | bid | +1.271% | +0.32% to +2.21% |
| Rich fifth | mid | +1.884% | +0.95% to +2.81% |
| No picking | bid | +0.414% | −0.11% to +0.95% |
| No picking | mid | +0.991% | +0.48% to +1.51% |
| Cheap fifth | bid | +0.518% | −0.42% to +1.45% |
| Cheap fifth | mid | +0.982% | +0.03% to +1.93% |
At the mid, all three ranges sit above zero, and the rich fifth stays the highest. So “only the rich fifth came out clearly ahead” holds when the sale is priced at the bid, which is what a seller could count on getting.
How sure we can be
Reports on the same day tend to move together. A market-wide shock on one afternoon hits every company reporting that week. If we treated each report as independent, the ranges would look narrower than they should. So the likely ranges come from resampling whole report days rather than single reports: the 171 rich reports fall on 68 different days, and each resample keeps every day’s reports together.
Where the reading is
Every company reporting in the next 14 days is on the board, with a richness reading for each one whose options give a clean one.