CompaniesEMREmerson ElectricWatch
EMR earnings: an expected move of 5.1%, an actual move of 4.9%.Averages over its last twelve reports. Here are all 17 reports.
Every Emerson Electric earnings report since Oct 2022: the expected move the options priced the day before, how far the stock moved by the close and by 10:00 the next morning, and the IV crush afterwards, how far implied volatility fell. We read option prices from real quotes at 15:46 ET. Definitions on the methodology page.
The options price an earnings move as one number. We take out the drift the stock would have had anyway, then rank what is left, the report’s own part, against EMR’s earlier reports. Both were fixed at 15:46 ET the day before, and the history below does the same for every report.
5.7% quoted, 5.2% of it the report
The options ran three trading sessions, so the quote also carries three days of the drift EMR has anyway: 2.4%. The two combine as squares, not sums, so 5.2 and 2.4 give 5.7. The report is 82% of that expiry’s risk.
Higher than six of its last twelve
We rank only the report’s part, and only against EMR’s own earlier reports, so a jumpy stock does not read rich for being jumpy. 5.2% is the 50th percentile: neither rich nor cheap for EMR. Read it as roughly there: its part has a wide error bar, 3.0% to 6.7%, which takes in every one of the twelve, so the board does not sort on it.
Moved 2.4%, inside the 5.2%
+2.4% by the next close, −0.6% by 10:00 the next morning. The rank compares the price with EMR’s past and does not forecast the move.
Inside its priced move after seven of twelve
Past it: Feb 2024 +10.4%, May 2024 +4.9%, Aug 2024 −7.6%, Nov 2024 +7.2% and May 2026 +6.9%.
+10.4% after the Feb 2024 report
The options had priced 3.7%.
Fell after every one, by 24% to 56%
Median fall 35%, at the strike nearest the price, day before to day after.
Held steady: 5.1% over the last four
From 5.1% over the eight before. The report’s own part of the move, with the ordinary drift taken out.
| Report | Report’s partPriced | Rank | RealizedC2C | By 10:00 | Priced · realized · ±15% | CrushATM | As-sold | Open | ForecastPred. | Error |
|---|---|---|---|---|---|---|---|---|---|---|
| Nov 4 ’26 | ±5.2% | ≈50 | +2.4% | −0.6% | −24% | −24% | — | — | — | |
| Aug 4 ’26 | ±4.9% | 42 | +2.3% | +2.2% | −33% | −21% | — | −31% | −2pt | |
| May 5 ’26 | ±5.0% | 50 | +6.9% | +4.8% | −33% | −22% | — | −32% | −2pt | |
| Feb 3 ’26 | ±5.4% | 73 | +3.4% | +2.0% | −42% | −36% | — | −48% | +7pt | |
| Nov 5 ’25 | ±5.7% | ≈80 | −3.8% | −3.3% | −28% | −35% | — | — | — | |
| Aug 6 ’25 | ±5.3% | 67 | −4.7% | −11.2% | −52% | −56% | −37% | −47% | −5pt | |
| May 7 ’25 | ±4.4% | 50 | +2.4% | +3.4% | −30% | −31% | −20% | −31% | 0pt | |
| Feb 5 ’25 | ±5.4% | — | −2.3% | −2.4% | −56% | — | — | −48% | −8pt | |
| Nov 5 ’24 | ±5.8% | — | +7.2% | +7.2% | −36% | −31% | −28% | −42% | +6pt | |
| Aug 7 ’24 | ±5.8% | — | −7.6% | −4.1% | −32% | −38% | −31% | −49% | +16pt | |
| May 8 ’24 | ±4.9% | — | +4.9% | +2.0% | −56% | — | −42% | −53% | −3pt | |
| Feb 7 ’24 | ±3.7% | — | +10.4% | +10.0% | −44% | — | −30% | −43% | −1pt | |
| Nov 7 ’23 | ±3.3% | — | −7.4% | −8.6% | −22% | — | −2% | −34% | +12pt | |
| Aug 2 ’23 | ±2.8% | — | +3.8% | +5.3% | −31% | −24% | −16% | −34% | +3pt | |
| May 3 ’23 | ±2.7% | — | +1.9% | +4.6% | −16% | −12% | −17% | −21% | +4pt | |
| Feb 8 ’23 | ±2.7% | — | −5.7% | — | −10% | −17% | — | −20% | +10pt | |
| Oct 31 ’22 | ±3.5% | — | −0.9% | — | −9% | −9% | — | −19% | +10pt | |
| All · 17 | ±4.5% avg | 7 ranked | 4.6% avg abs | 4.8% avg abs | −32% median | −24% median | −28% median | −34% median | 5.9pt avg abs |
What the columns mean6 groups · 10 columns
- Report’s part
- The report’s share of what options priced at 15:46 ET the day before, taken from two or more expiries.
- ColumnsPriced
- Rank
- Where the report’s part sits among EMR’s own earlier reports, up to twelve, from 0 to 100: 50 on Nov 4 ’26 means it was priced higher than 6 of the 12 before it. Rich and cheap mark the top and bottom of that range. It needs eight earlier reports with a 10:00 move, so the oldest rows have none. ≈ marks a rank whose report’s part was uncertain: read it as roughly there, not exactly.
- ColumnsRank
- Realized
- C2C is the move to the next close; By 10:00, the move to 10:00 the next morning.
- ColumnsC2CBy 10:00
- Chart
- The grey band is what the options priced, the dark mark where the stock closed, the bar where it stood at 10:00, on a ±15% scale.
- ColumnsPriced · realized · ±15%
- Crush
- How far implied volatility fell in the report’s expiry, from 15:46 ET the day before to the day after: at the new strike ATM and at the old one As-sold. Open reads it from the option’s 10:00 quotes the next morning, and is blank where there was none.
- ColumnsATMAs-soldOpen
- Forecast
- Pred. is the crush we published the day before, graded on the public record. Error is what happened minus the forecast, in points of the crush.
- ColumnsPred.Error
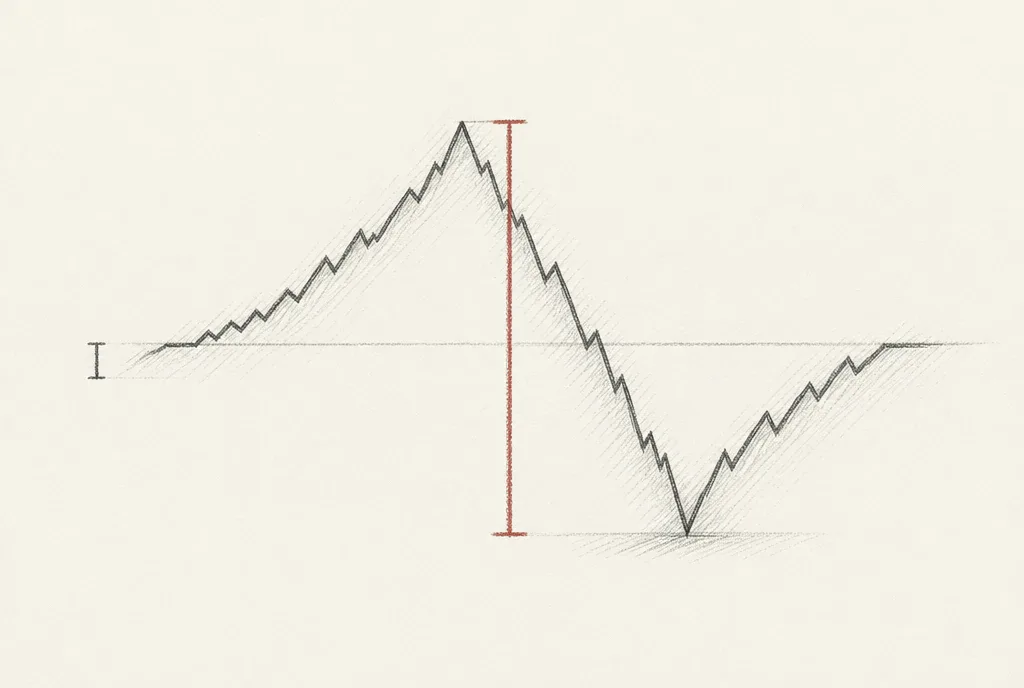 to the closein between
Closing prices miss the open
If you hold through the report you meet the open, not the close. We publish both: the move from one close to the next, and where the stock stood at 10:00 the next morning.
 the reportordinary
Option prices cover more than the report
An expiry a week out also carries a week of ordinary movement. Comparing two expiries that both contain the report separates the two, and the report's share is the priced move.
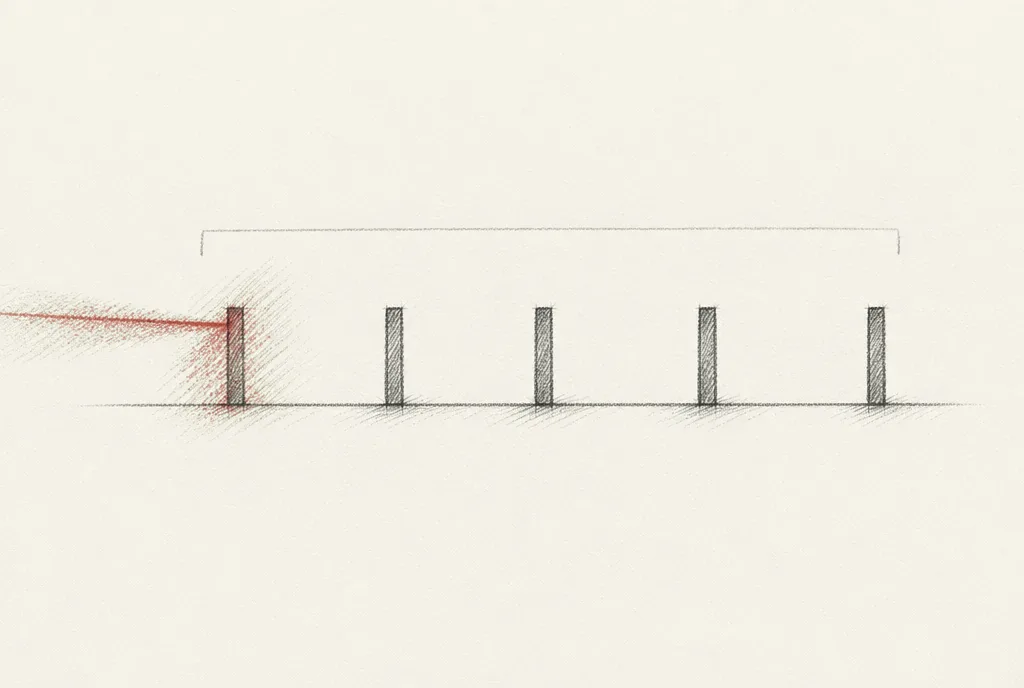 the one that movedwhat 30 days average
We measure the expiry that moved
A 30-day average mixes the expiry holding the report with expiries it never reaches, so it reads shallower than what you held. We read the expiry that holds the report, the day before and the day after, at both strikes.
One expiry contains the report. The 30-day figure is an average that also covers expiries the report never reaches. Every column below leans the same way, so the gap shows on each report, not only in the median.
Each row is one report: the band is what the options priced, the mark is where the stock closed, and the bar runs to where it stood at 10:00 the next morning. On 1 of 15 reports with both, the close and 10:00 pointed opposite ways.
Where the 10:00 number is missing, the cell stays blank instead of borrowing the close, and the data-quality grid below says why. How far apart the two run differs from company to company; this window measures it for EMR.
The split reads the report out of the gap between the two lines. The small figure under each date is how many trading sessions the expiry holding the report had left. A shorter one carries the same report over fewer days, so it reads higher without the report being priced any bigger.
Drawn for the last twelve reports, like the other figures on this page. It is history; the current curve is on the board.
Counted over the 17 reports shown. Two markers are on every report (crush expiry substituted and macro event in the window), so they describe EMR rather than any one quarter. The other 14 are on between one and 14 reports.
Every marker on the reports above is counted here, one cell per report, newest first as in the history table.
’26Aug 4
’26May 5
’26Feb 3
’26Nov 5
’25Aug 6
’25May 7
’25Feb 5
’25Nov 5
’24Aug 7
’24May 8
’24Feb 7
’24Nov 7
’23Aug 2
’23May 3
’23Feb 8
’23Oct 31
’22reports
What each marker means16 markers · 3 withhold a number
Withheld
- no trade at the cover8 of 17
open_crush_no_trade - The option legs did not trade at the 10:00 cover anchor, so the crush there could not be measured. It comes from the tape, not an outage, so it is permanent and counts in the published coverage ratio.
- Lands inOpen
- no prediction2 of 17
crush_pred_unavailable - No predicted crush could be frozen for this print, so it has no entry in the scored accuracy record. Never filled in afterwards — a prediction written after the outcome is not one.
- Lands inPred.Error
- no 10:00 tape2 of 17
rm_intra_unavailable - The equity minute bars behind the 10:00 anchor do not exist for this session, so the anchor is blank and stays blank. It is never substituted from the opening price: a history with two different anchors mixed together is worse than a shorter one.
- Lands inBy 10:00Open
Shown, kept off the board’s sort
- wide decomposition band2 of 17
decomp_low_confidence - The decomposed implied move has a wide confidence band on this row. The number is published and kept off the board’s sort, because a sort cannot express an error bar; where its rank is shown, it is marked ≈.
- Lands inPriced move
- derived numbers unreliable2 of 17
derived_unreliable - Quotes on this name were too wide — or a 25Δ wing was missing — for the derived numbers on this row to be trusted: implied move, decomposition, crush and skew. Shown, kept off the board’s sort, and marked ≈ where its rank is shown.
- Lands inThe derived columns
- wide straddle quote2 of 17
wide_quote - The T−1 straddle’s bid-ask spread was wide relative to its own price, so every number read off that quote inherits the width. Published on purpose — the friction is real — but kept off the board’s sort, and marked ≈ where its rank is shown.
- Lands inImplied (naive)Short-straddle P&Lon the ticker page, not this one
- thin trade at the cover1 of 17
open_crush_thin_trade - Too few prints stand behind the 10:00 anchor for it to be a reliable price. The crush is shown and kept out of the rankings.
- Lands inOpen
Shown as measured
- crush expiry substitutedevery report
crush_expiry_substituted - The expiry that would have been measured was not available on both sides of the print, so a neighbouring one stood in. The crush is real; it is measured on a slightly different contract than the label implies.
- Lands inATM
- macro event in the windowevery report
decomp_macro_window - A scheduled macro event (a CPI print, an FOMC day) falls inside the decomposition window, so a little of the volatility attributed to the event belongs to the calendar instead.
- Lands inPriced move
- held to expiry14 of 17
cover_mark_settled - The straddle that was sold expired at one of these closes, so its price there is its settlement value: the distance from the stock to the strike. That exit pays no bid/ask spread, and it ignores the cost of being assigned stock on the in-the-money leg.
- Lands inShort-straddle P&Lon the ticker page, not this one
- next-morning price from quotes9 of 17
open_crush_restruck_quoted - The option at the 10:00 strike did not trade on both sides between 09:55 and 10:05, so the next-morning volatility was read from the midpoint of its quoted bid and ask over the same ten minutes. Used only when both sides were quoted and the quote was less than 50% wide.
- Lands inOpen
- skew contamination8 of 17
crush_skew_contaminated - The gap between the strike sold and where the stock ended up is large enough that the as-sold crush cannot stand in for the comparable one, so this print carries no scored open crush.
- Lands inAccuracy recordon the public record, not this one
- no re-struck cover IV8 of 17
open_crush_restruck_unavailable - The comparable at-the-money volatility could not be read at the 10:00 anchor, so only the as-sold contract is available there.
- Lands inOpen
- noisy IV rank4 of 17
iv_rank_noisy - This name’s quote width is large against its own 52-week volatility range, so the rank carries a read error worth noting. A true property of a quiet name, not a defect — the rank itself is computed normally.
- Lands inIV rankon the ticker page, not this one
- gapped past the wings1 of 17
open_crush_gap_otm - The stock gapped far enough that the contract sold at T−1 is no longer near the money at the cover, so the as-sold crush there is partly a move along the smile rather than a collapse in volatility.
- Lands inOpen
- next-morning quote too wide1 of 17
open_crush_restruck_quote_wide - The option at the 10:00 strike did not trade on both sides between 09:55 and 10:05, and its quoted bid and ask were 50% of the midpoint or wider, too wide to read a volatility from. So there is no next-morning read at that strike.
- Lands inOpen
Six companies whose reports traded like EMR’s
The closest on all three numbers at the top of each company page. It compares how the reports traded, not the businesses.
- Reported · the fortnight to 5 Nov · settled, free
- Next 14 days · 523 names · symbol and date free
- ·AAONMon 9AMC—
- ·ABCLMon 9AMC—
- ·ACHRMon 9AMC—
- ·AIOTMon 9BMO—
- 11 of 523 shown · the next 14 days
The ranked columns are the board
Symbol and date are free for all 523 names. A subscription fills in the three columns held back on every locked row: the priced move, its richness against that name's own last twelve reports, and the ratio between them.
A free account adds today’s board rows and the full 14-day calendar, without these three columns.
Today's board rows and the full forward calendar are on your board.
- ·ALTGMon 9AMC—
- ·AMCXMon 9AMC—
- ·AMGMon 9BMO—
- ·AMPYMon 9AMC—
- ·AMRCMon 9AMC—
- ·ANNXMon 9BMO—
- ·APEIMon 9AMC—
| # | Name | Report | Priced move | Richness · own history | Ratio | Outcome |
|---|---|---|---|---|---|---|
| Reported · the fortnight to 5 Nov · settled, free | ||||||
| 1 | COPConocoPhillips | Nov 5BMO | 3.4% | 100 | 1.79 | inside |
| 2 | EOGEOG Resources | Nov 5AMC | 4.2% | 100 | 1.58 | inside |
| 3 | GEOGeo Group | Nov 5BMO | 9.8% | 100 | 1.31 | inside |
| 4 | GHGuardant Health | Nov 5AMC | 19.1% | 100 | 2.10 | inside |
| 5 | KTOSKratos Defense & Security Solutions | Nov 5AMC | 11.9% | 100 | 1.59 | inside |
| Next 14 days · 523 names · symbol and date free | ||||||
| · | AAON | Mon 9AMC | — | |||
| · | ABCL | Mon 9AMC | — | |||
| · | ACHR | Mon 9AMC | — | |||
| · | AIOT | Mon 9BMO | — | |||
12 of 523 shown · the next 14 days
The ranked columns are the boardSymbol and date are free for all 523 names. A subscription fills in the three columns held back on every locked row: the priced move, its richness against that name's own last twelve reports, and the ratio between them. A free account adds today’s board rows and the full 14-day calendar, without these three columns. Today's board rows and the full forward calendar are on your board. | ||||||
| · | ALTG | Mon 9AMC | — | |||
| · | AMCX | Mon 9AMC | — | |||
| · | AMG | Mon 9BMO | — | |||
| · | AMPY | Mon 9AMC | — | |||
| · | AMRC | Mon 9AMC | — | |||
| · | ANNX | Mon 9BMO | — | |||
| · | APEI | Mon 9AMC | — | |||
| · | APPS | Mon 9AMC | — | |||
How to read this page
- History table
- Its columns are explained right under it: What the columns mean ↑
- Coverage
- EMR’s 17 reports. The board rows are the fortnight’s five richest settled reports, then the first of the next 523 names.
- Ratio
- The priced move over the name’s typical actual move.
- Markers
- Notes on a report’s data, counted in the data-quality grid with what each one touches.
A number looks wrong? Tell us what you expected and we’ll check it.Report a data issue
History is a record, not a forecast. Derived values only; no option prices are shown. Nothing here is investment advice.