Earnings recap
Implied vs actual earnings moves: Oct 13–16, 2026
October 13 to 16: the three richest reports all paid a seller, the cheap fifth lost. How the reading works, and how our forecasts did against what happened.
Before every earnings report, the board gives the company a richness reading: how rich its options are compared with its own past reports. In the week of October 12, its three groups finished in the order the reading pointed to, and most stocks moved less than their options implied. No company we cover reported on Monday the 12th, so the week’s reports run from Tuesday the 13th to Friday the 16th.
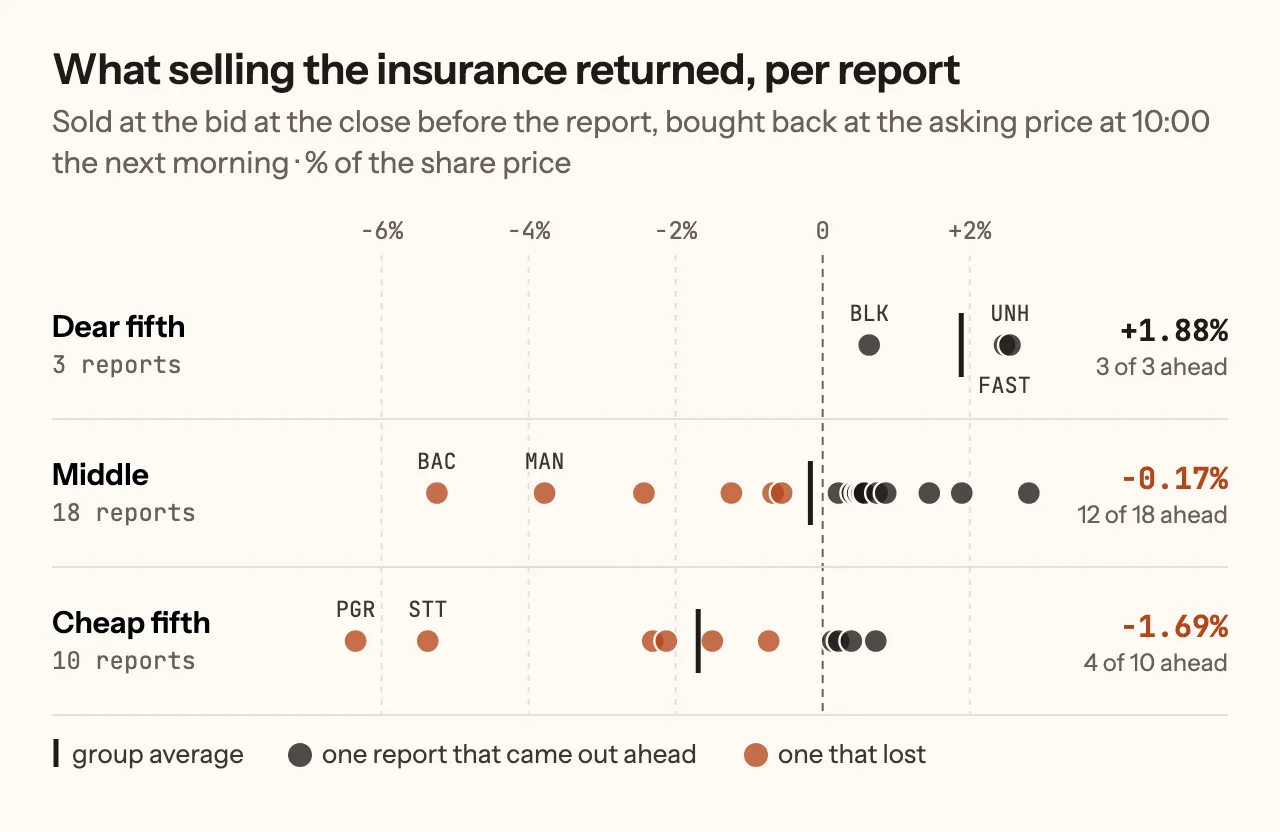
The three reports with the richest readings were BlackRock, UnitedHealth and Fastenal. Selling options on each of them the evening before the report and buying them back the next morning came out ahead all three times, by 1.88% of the share price on average. The ten reports with the cheapest readings lost 1.69% on average, and only four of them came out ahead. Selling all 31 ranked reports without looking at the reading lost 0.46% per report.
| Group | Reports | Came out ahead | Average result |
|---|---|---|---|
| Rich fifth | 3 | 3 | +1.88% |
| Middle | 18 | 12 | −0.17% |
| Cheap fifth | 10 | 4 | −1.69% |
| All 31, no picking | 31 | 19 | −0.46% |
That is the same order the reading has shown over a much longer record. Across 9,910 settled reports, the richest fifth delivered the smallest share of its priced move. On reports whose options expired the day after, the rich fifth was the only group that came out clearly ahead.
How the reading works
Before a report, the price of a straddle (a call and a put at the same strike, the one nearest the share price) tells you how big a move the market is paying for. We call that the priced move. Part of it is the stock’s ordinary day-to-day movement, which it would have with or without the news. We strip that part out and compare what is left, the move priced for the report itself, with the same company’s own past reports.
The result is a percentile. A reading of 90 means this report is priced richer than 90% of the company’s earlier ones; a reading of 10 means it is cheaper than all but 10%. It compares a company with itself, never with other companies, and it says nothing about which way the stock will go. The board lists the richest readings first. The full definition is in the methodology.
40 of the week’s 50 settled reports had a reading. Nine of those had option quotes too wide to trust, and the board leaves those unranked (more on them below). That leaves 31: three in the rich fifth, with readings of 80 or above, 18 in the middle, and ten in the cheap fifth, at 20 or below.
What the stocks did
We measure the actual move from the close before the report to 10:00 the next morning, which is when a seller who buys back early sees it. Across all 49 reports with a 10:00 reading, 39 moved less than they were priced for; the typical priced move was 4.6% and the typical actual move 1.8%. Options before a report usually cost more than the move turns out to be worth, and the reading’s job is to say where that gap is widest. Here is each of the 31 ranked reports against its priced move, richest reading at the top.
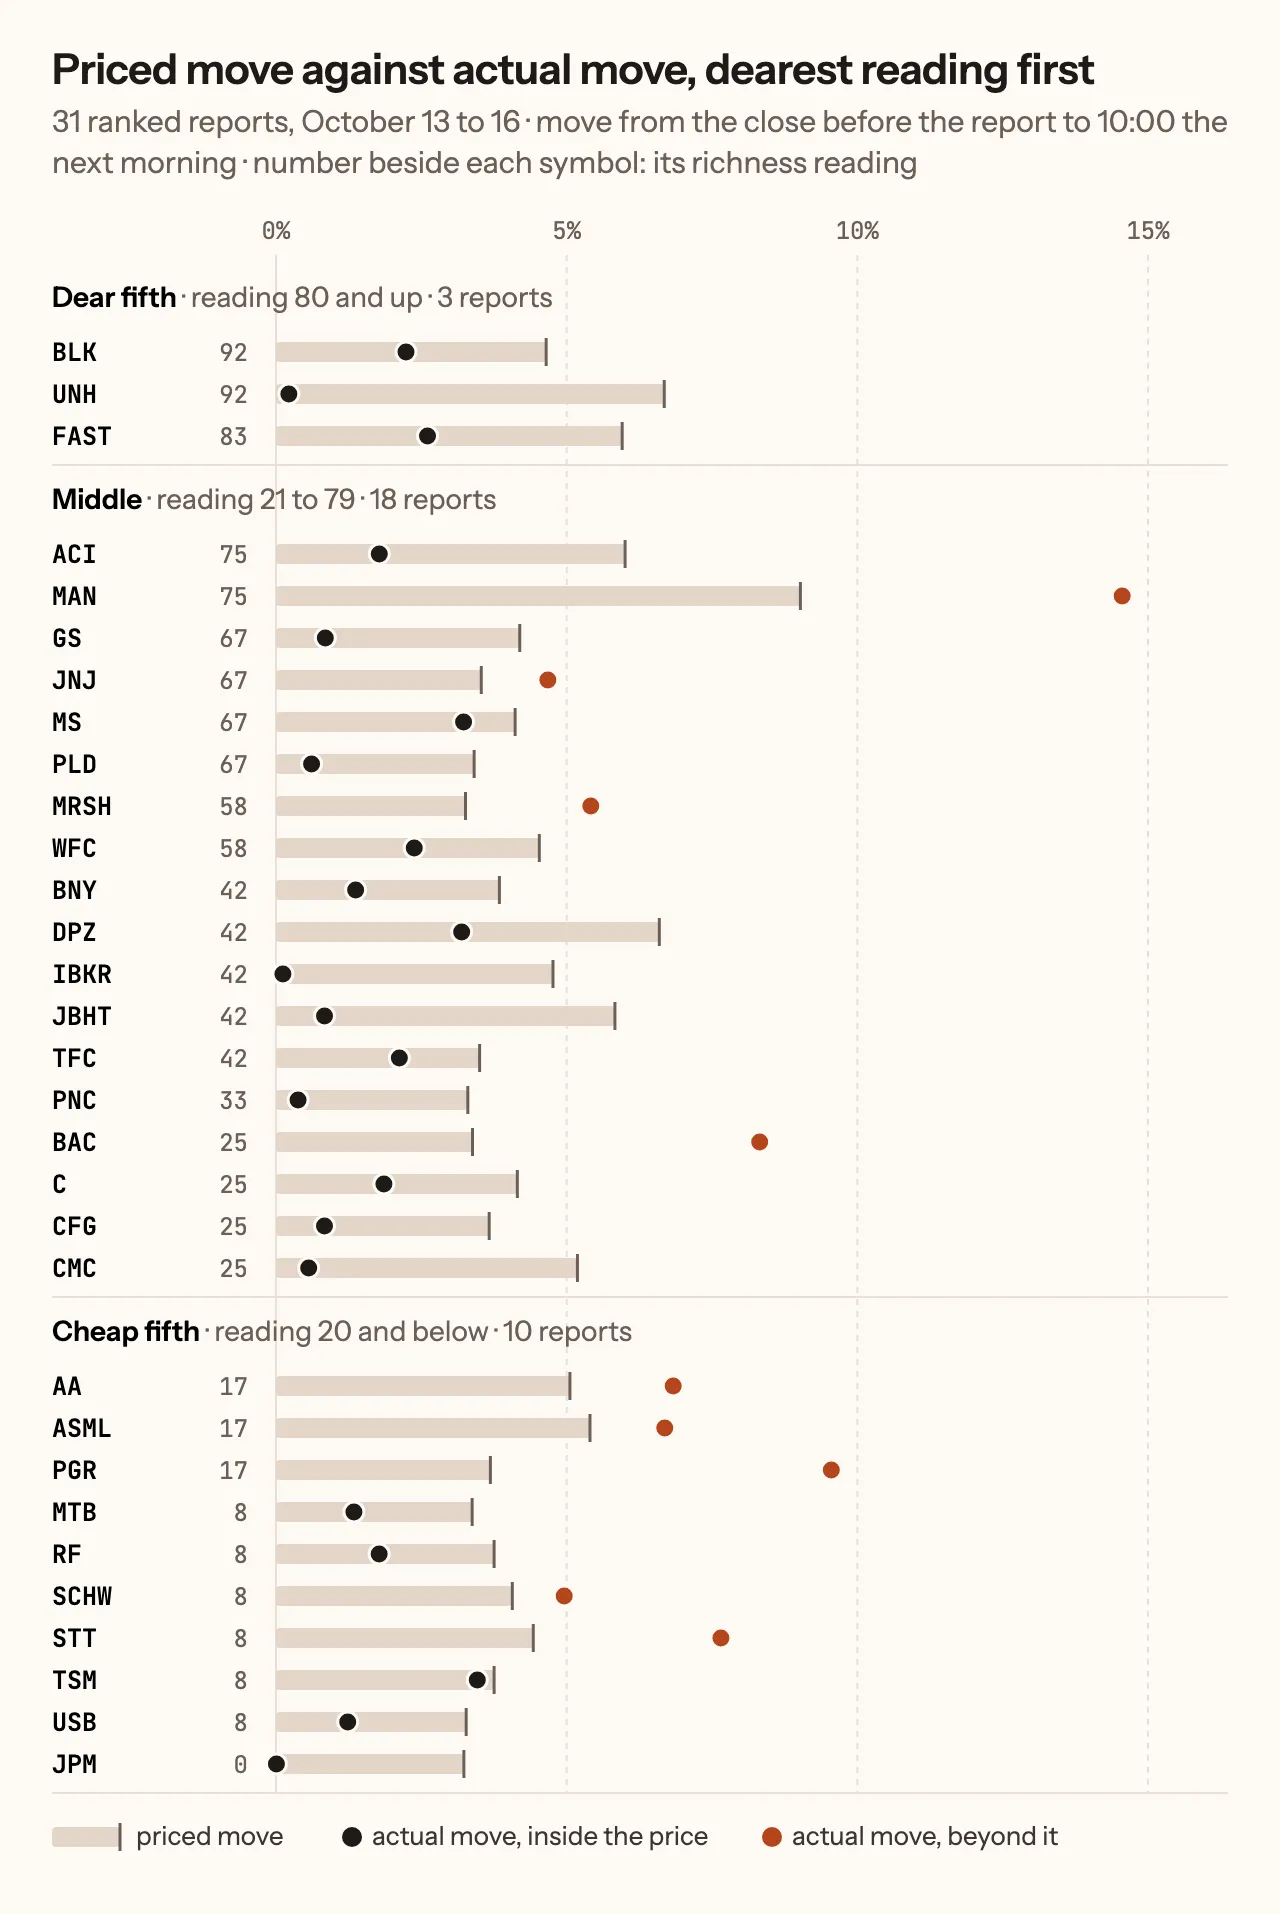
None of the three rich reports came close to its priced move. UnitedHealth was priced for 6.7% and moved 0.2%. In the cheap fifth, half the reports moved further than they were priced for: Progressive was priced for 3.7% and was down 9.6% by 10:00, and State Street was priced for 4.4% and moved 7.7%. In the middle, four of 18 did.
For each report we priced the simplest trade the reading speaks to: sell the straddle at the bid at the close before the report, then buy it back at the asking price at 10:00 the next morning. Those are prices a seller could actually have traded at, so every result already pays the gap between bid and ask in both directions.
Our implied volatility forecast
Before each report we also publish how far implied volatility, the rate options charge for movement, should collapse once the news is out. We grade every forecast at the close the day after and keep it on the record, hits and misses alike.
32 of last week’s reports got a forecast and a grade, and 17 of them landed within 5 points of the collapse. The closest was State Street: we said implied volatility would collapse 8.3%, and it collapsed 7.7%. ASML was next, 24.1% against 23.4%.
| Company | We said | It collapsed | Miss |
|---|---|---|---|
| State Street | 8.3% | 7.7% | 0.6 points |
| ASML | 24.1% | 23.4% | 0.7 points |
| M&T Bank | 8.1% | 7.2% | 0.9 points |
| Wells Fargo | 26.2% | 24.7% | 1.5 points |
| Marsh | 5.5% | 17.7% | 12.2 points |
| Albertsons | 29.2% | 12.7% | 16.5 points |
The average miss for the week was 5.8 points, wider than the live record’s 4.1 at the time. Where we missed, we mostly forecast too deep a collapse: on 20 of the 32 it ran smaller than we said, by 1.2 points on average across the week. Albertsons was the widest: 29.2% forecast, 12.7% actual. Marsh missed the other way, collapsing 17.7% against the 5.5% we said.
Why the board leaves some reports unranked
Thirteen of the week’s reports had thin option quotes but could still be priced as a trade. At the halfway price between bid and ask, selling them looked fine: +0.73% of the share price on average. At prices a seller could actually have traded at, the same trades lost 6.64% per report.
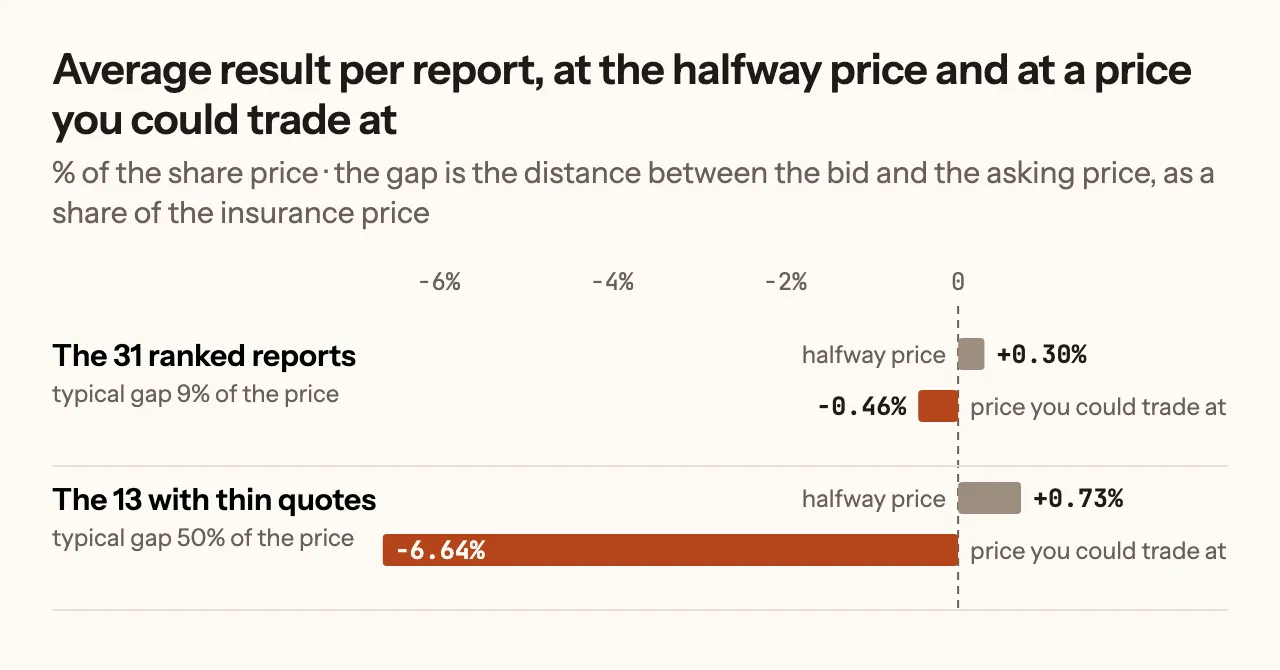
On these names the gap between bid and ask was typically half the price of the straddle, against 9% on the ranked reports. When the bid sits that far below the asking price, a seller gives away most of the premium before the stock moves at all. A reading on prices like that would look precise and mean little, so the board shows none.
How much one week can tell you
Most of last week’s reports were banks: 35 of the 50 were banks or other financial companies, from JPMorgan Chase and Goldman Sachs on Tuesday to Regions and Truist on Friday. Reports like these react to the same interest rates on the same days, so they are less independent than 50 separate reports would be.
Three reports in the rich fifth is also a small group. If you pick three of these 31 at random, their average is as good as the rich fifth’s less than once in a hundred tries, so the result is unlikely to be luck within the week. What one week cannot show is how often it repeats, which is why we publish the long record beside it.
The reading also missed inside its groups. ManpowerGroup read 75, just short of rich, was priced for 9.0% and fell 14.6%. JPMorgan Chase had the cheapest reading possible, 0, and barely moved.
Where the reading is
Every company reporting in the next 14 days is on the board, richest reading first, with a reading for each one whose options give a clean one. A free account opens today’s rows; the rest of the fortnight is what a subscription adds.