Earnings recap
Implied vs actual earnings moves: Oct 19–23, 2026
October 19 to 23: the stocks with the richest readings moved the smallest share of their priced move, and seven of the eight that read 100 paid a seller.
Before every earnings report, the board gives the company a richness reading: how rich its options are compared with its own past reports. The week of October 19 had 294 reports, nearly six times as many as the week before, and the stocks with the richest readings moved the smallest share of what their options implied. In the rich fifth the typical stock moved 42% of its priced move. In the middle it moved 64%, and in the cheap fifth 66%.
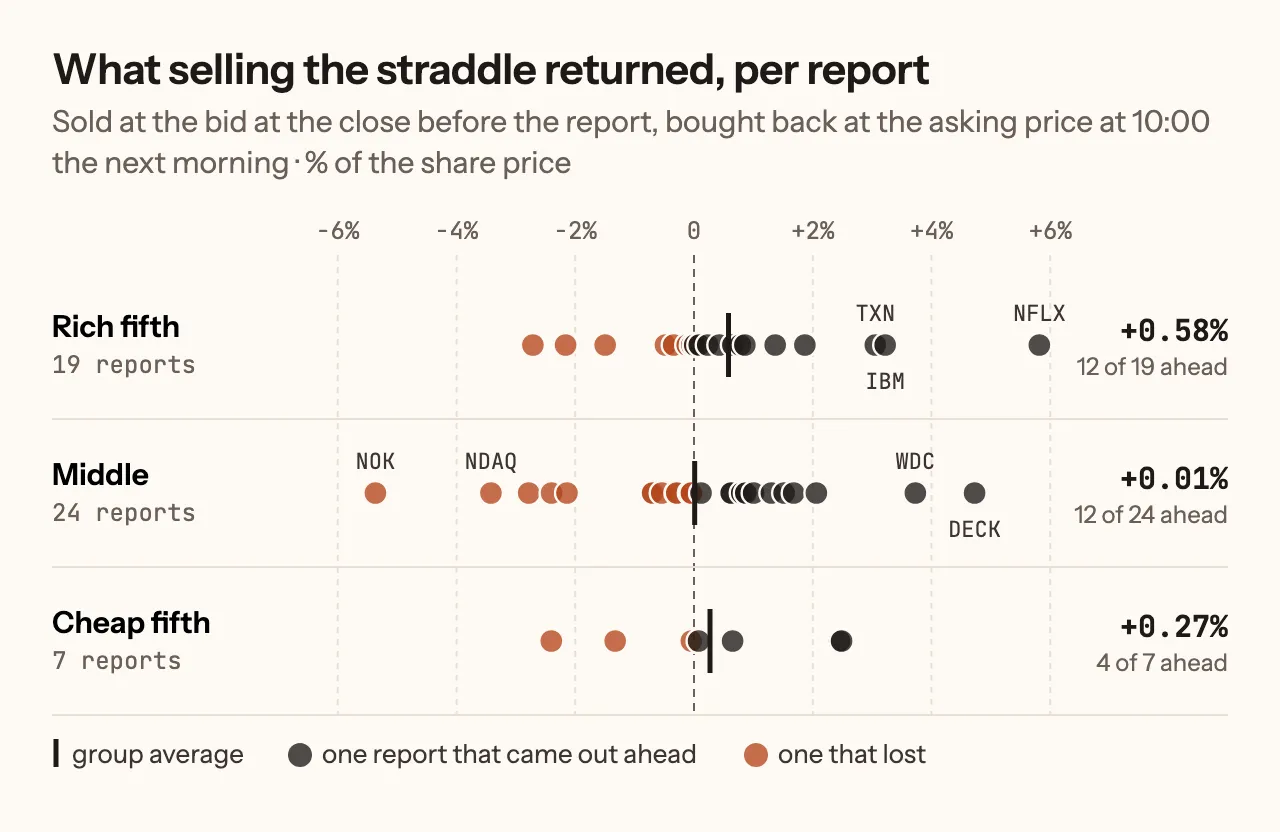
Eight reports read 100, which means they were priced richer than every earlier report from the same company. Selling the straddle at the close before the report and buying it back at 10:00 the next morning came out ahead on seven of the eight, by 1.58% of the share price on average. Netflix was priced for a 9.3% move and moved 2.7%, and the trade made 5.82%. Across the whole rich fifth it made 0.58% per report.
| Group | Reports | Came out ahead | Average result |
|---|---|---|---|
| Rich fifth | 19 | 12 | +0.58% |
| Middle | 24 | 12 | +0.01% |
| Cheap fifth | 7 | 4 | +0.27% |
| All 50, no picking | 50 | 28 | +0.26% |
The rich fifth finished first. Below it the order did not hold this week: the seven cheap reports beat the middle, mostly because Tesla and QuantumScape barely moved. The share of the move ran in the reading’s order across all three groups, which is what the reading has shown over a much longer record. Across 10,092 settled reports, the richest fifth delivered the least of its priced move. On reports whose options expired the day after, the rich fifth was the only group that came out clearly ahead.
How the reading works
Before a report, the price of a straddle (a call and a put at the same strike, the one nearest the share price) tells you how big a move the market is paying for. We call that the priced move. Part of it is the stock’s ordinary day-to-day movement, which it would have with or without the news. We strip that part out and compare what is left, the move priced for the report itself, with the same company’s own past reports.
The result is a percentile. A reading of 90 means this report is priced richer than 90% of the company’s earlier ones; a reading of 10 means it is cheaper than all but 10%. It compares a company with itself, never with other companies, and it says nothing about which way the stock will go. The board lists the richest readings first. The full definition is in the methodology.
184 of the week’s 294 reports had a reading. For 129 of them the nearest option expiry after the report was weeks away, and five more had option quotes too wide to trust, so the board leaves all of those unranked (more on them below). That leaves 50: 19 in the rich fifth, with readings of 80 or above, 24 in the middle, and seven in the cheap fifth, at 20 or below.
What the stocks did
We measure the actual move from the close before the report to 10:00 the next morning, which is when a seller who buys back early sees it. 42 of the 50 ranked reports moved less than they were priced for; the typical priced move was 5.8% and the typical actual move 3.1%. Here is each one against its priced move, richest reading at the top.
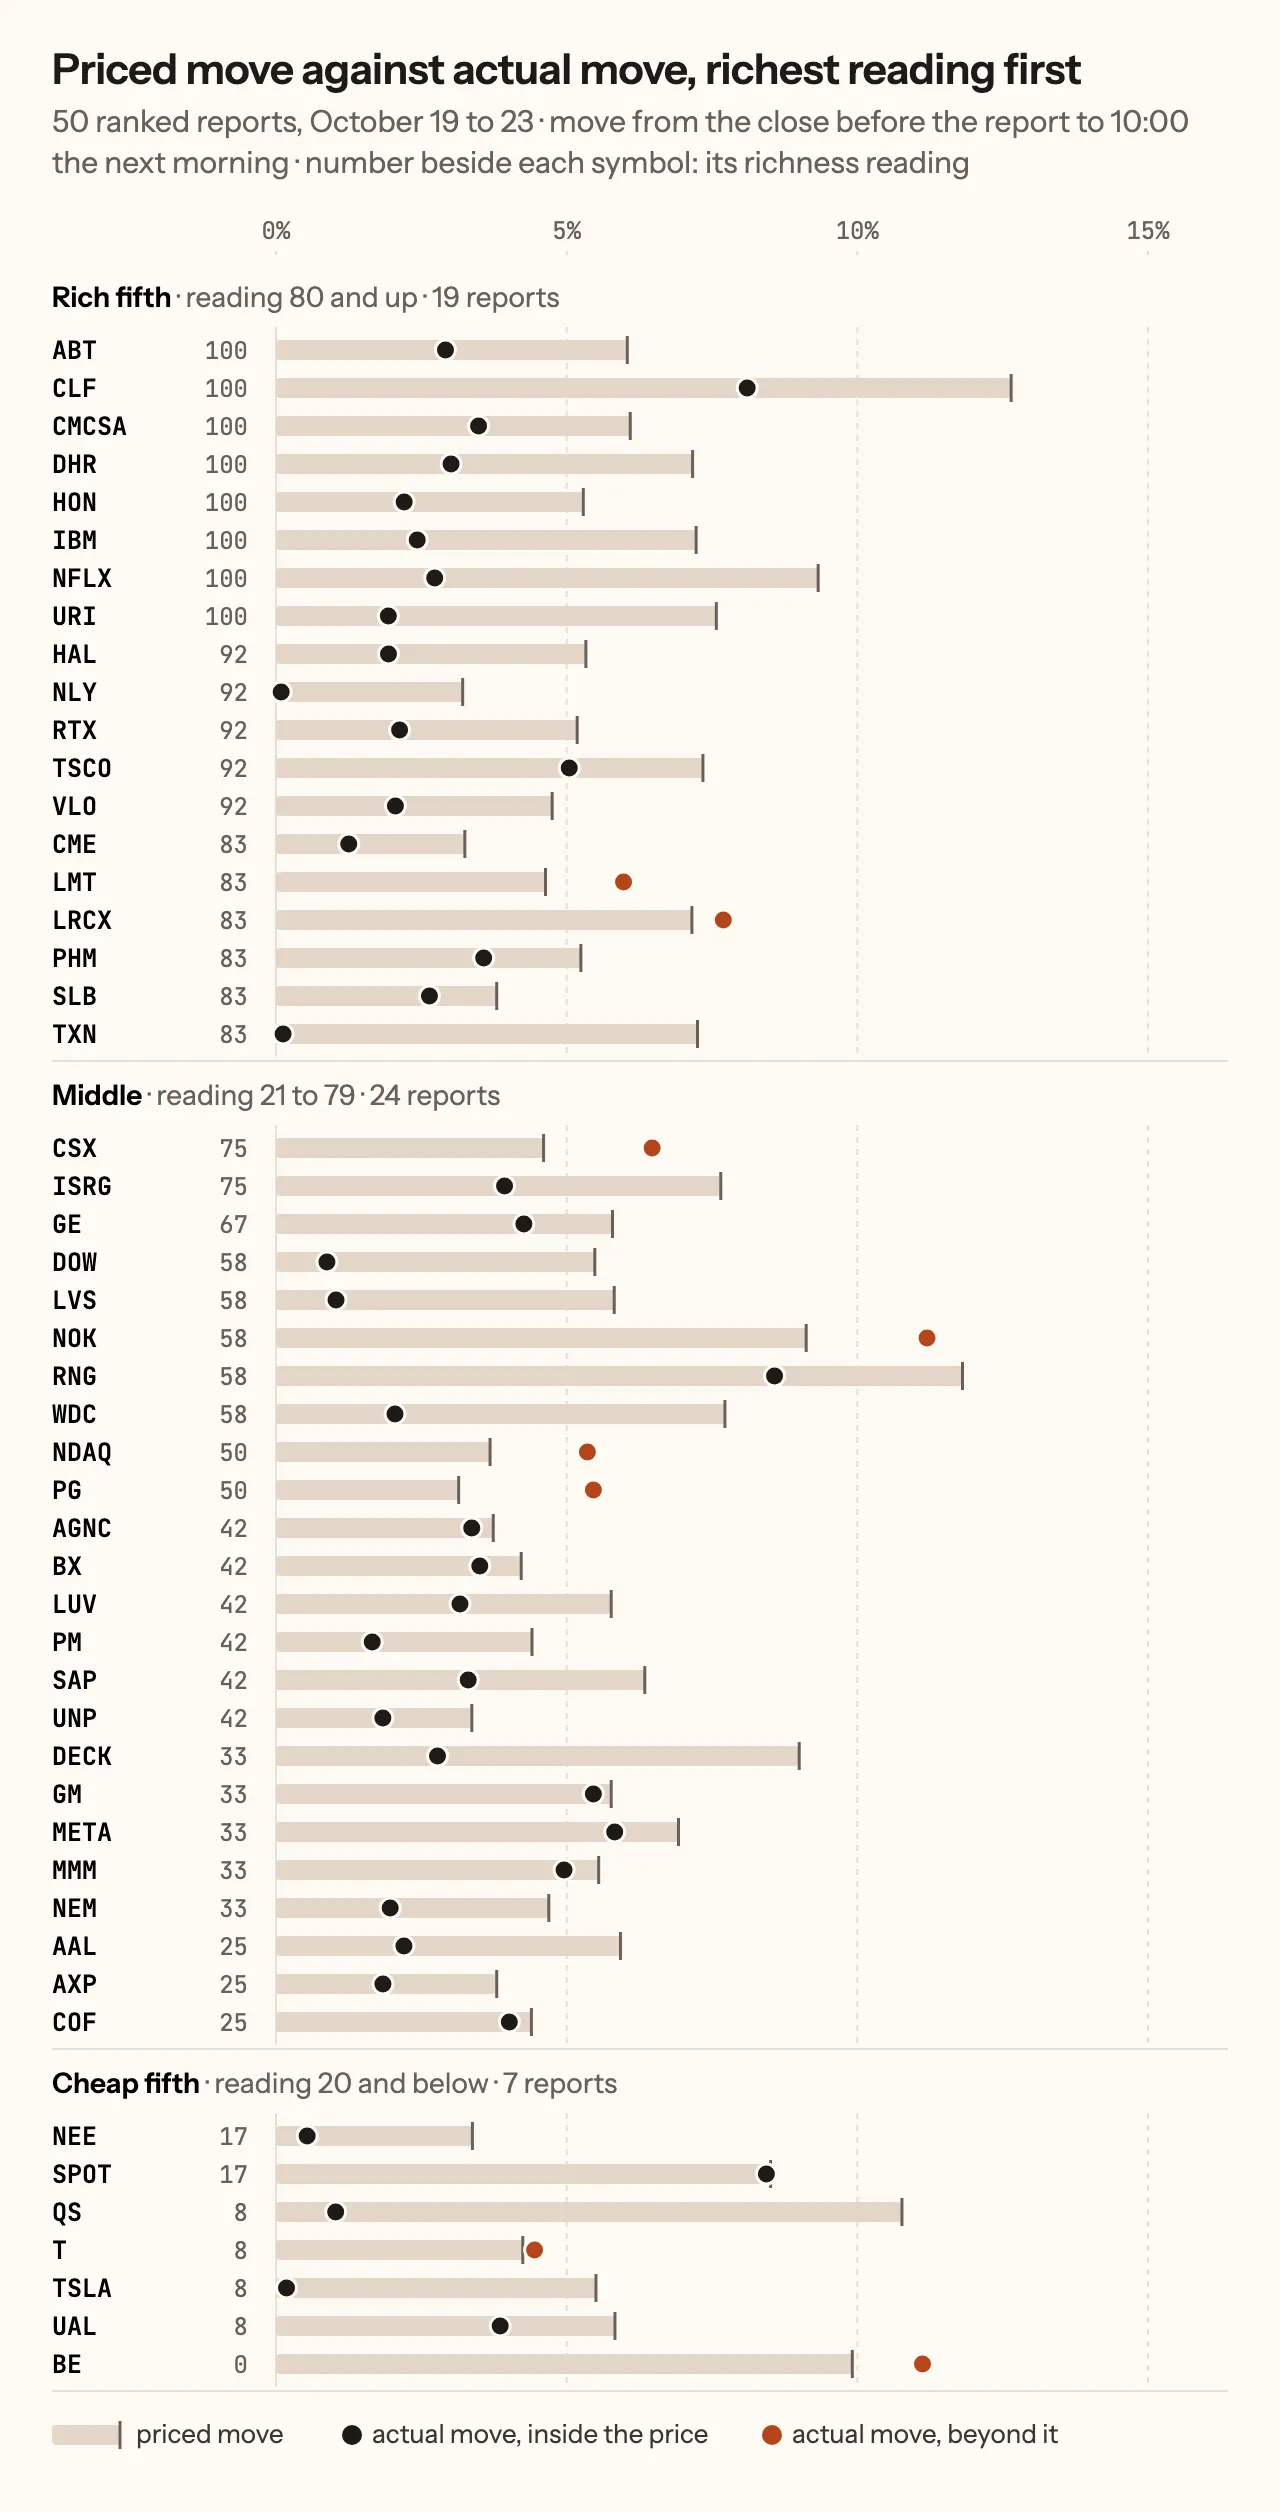
Two of the 19 rich reports moved further than they were priced for, against four of 24 in the middle and two of seven in the cheap fifth. Texas Instruments read 83, was priced for 7.3% and moved 0.1%. The misses were Lockheed Martin and Lam Research, both at 83, which moved a little past their price. In the cheap fifth, Bloom Energy had the cheapest reading possible, 0, was priced for 9.9% and moved 11.1%.
For each report we priced the simplest trade the reading speaks to: sell the straddle at the bid at the close before the report, then buy it back at the asking price at 10:00 the next morning. Those are prices a seller could actually have traded at, so every result already pays the gap between bid and ask in both directions.
Our implied volatility forecast
Before each report we also publish how far implied volatility, the rate options charge for movement, should collapse once the news is out. We grade every forecast at the close the day after and keep it on the record, hits and misses alike.
52 of last week’s reports got a forecast and a grade. The closest was Dow: we said implied volatility would collapse 26.7%, and it collapsed 26.7%. NextEra Energy was next, 26.1% against 26.0%. In all, 33 of the 52 landed within 5 points.
| Company | We said | It collapsed | Miss |
|---|---|---|---|
| Dow | 26.7% | 26.7% | 0.0 points |
| NextEra Energy | 26.1% | 26.0% | 0.1 points |
| Capital One | 22.4% | 21.6% | 0.8 points |
| Nasdaq | 25.6% | 24.7% | 0.9 points |
| Texas Instruments | 39.7% | 26.9% | 12.8 points |
| AGNC | 22.5% | 5.1% | 17.4 points |
The average miss was 4.8 points, a little wider than the live record’s 4.4 at the time, but the misses mostly went one way: on 48 of the 52, implied volatility collapsed less than we said. Across the whole record the forecast leaned that way by 0.8 points; this week it leaned by 4.3. AGNC was the widest miss, ahead of Blackstone (13.8) and Lam Research (13.5), and Texas Instruments was next.
Why Texas Instruments and AGNC missed
The forecast reads, from the option prices the day before, where implied volatility should settle once the report is out, and it allows for a Fed decision or an inflation report still ahead of the options we grade. This week two things held implied volatility above that, and these two reports were hit hardest by both.
The first was the Fed. Both companies’ nearest options expired on Friday the 23rd, too close to the report to grade, so we graded the options expiring a week later, on October 30. The Fed announced its rate decision on October 28, inside that extra week, and options charged more for it. The forecast allows for a Fed decision still ahead, but by 1.7 points, the typical effect across past reports (how the forecast is made), and these two companies’ options charged far more for this one.
AGNC holds mortgage bonds, so its shares move with interest rates. Before the report, its options charged 35% for the Fed week and 22 to 24% for the quiet weeks after it. By our estimate that gap accounts for about 12 of its 17.4 points, after the forecast’s allowance for the Fed. Most of the rest came from the stock itself. AGNC moved 4.3%, more than the 3.7% it was priced for, and the day after the report its options were still charging 42% for the three days left in the week.
Texas Instruments had the Fed week too, worth about 4 of its 12.8 points after the same allowance. Most of the other 8 came from the day we graded it. On October 22, implied volatility rose across the market: about 16% on options on funds tracking the S&P 500, 19% on the Nasdaq 100, and 17 to 18% on chip stocks, which fell about 7% that day. Texas Instruments’ implied volatility for the month ahead ended the day about 16% above what its options had pointed to before the report, though the stock itself fell only 1.6%. Nothing in the forecast could have seen that day coming, and the extra volatility faded over the following sessions.
The same two things explain much of the week. The 25 reports graded on October 22 missed by 5.8 points on average, against 2.5 for those graded the day before and 3.4 for those graded the day after. Every report graded this week was measured on options that held the Fed meeting. The allowance comes from the roughly 12,000 earlier reports we rebuilt from history: without it, the forecast leaned 3.1 points when neither a Fed meeting nor an inflation report fell inside the graded options and 6.1 when both did; with it, 2.3 and 2.5. It covers the average Fed week, not one that options price as heavily as these two did. The point splits for the two companies are our estimates, worked out from their option prices before and after the report, so treat them as approximate. Both misses stay on the record as graded.
Why the board leaves some reports unranked
202 of the unranked reports could still be priced as a trade. At the halfway price between bid and ask, selling them roughly broke even: +0.04% of the share price on average. At prices a seller could actually have traded at, the same trades lost 7.56% per report.
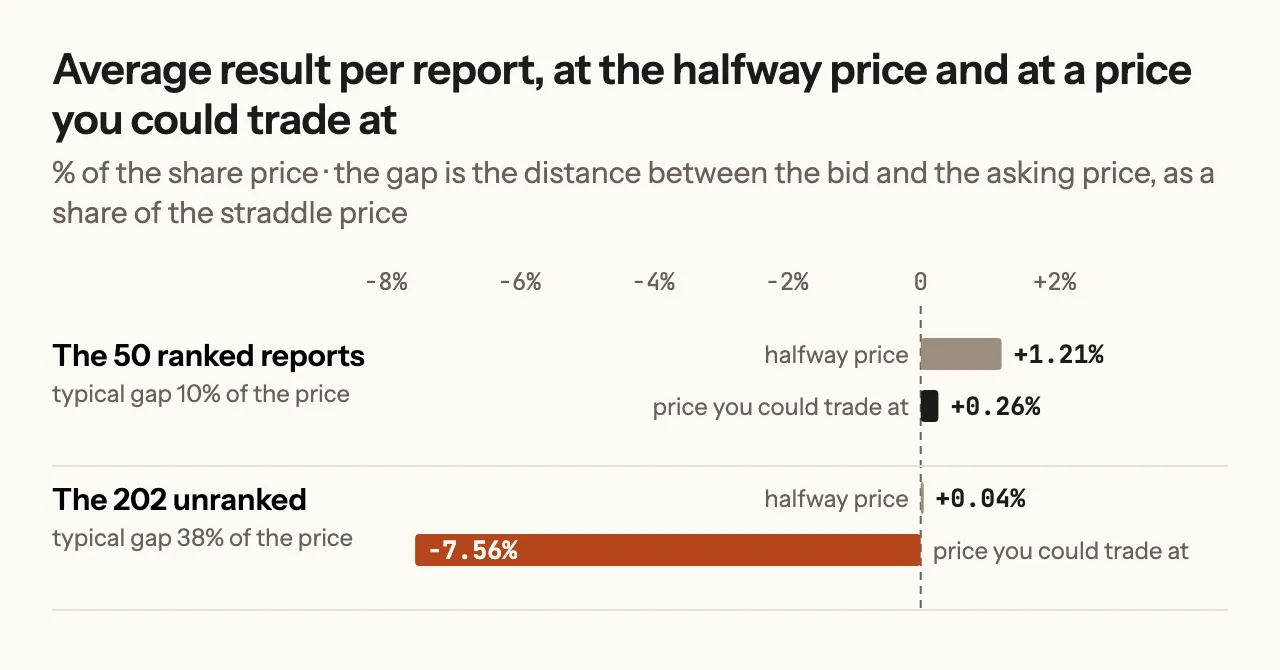
On these names the gap between bid and ask was typically 38% of the straddle’s price, against 10% on the ranked reports. Most of them had options that ran for weeks past the report, so the report was only a small part of what the straddle cost. A reading there would mostly measure ordinary movement, and the gap would take much of the premium before the stock moved at all, so the board shows none.
How much one week can tell you
If you pick 19 of these 50 reports at random, their average is as good as the rich fifth’s about one time in five. On the money, then, one week is weak evidence. The cheap fifth is small too: seven reports, and two of them carried its average.
The week was at least spread out. The week before was mostly banks reacting to the same interest rates, while this one ran from Netflix and Tesla to Procter & Gamble and Lockheed Martin, so its reports were more independent of each other. What one week cannot show is how often a result repeats, which is why we publish the long record beside it.
Where the reading is
Every company reporting in the next 14 days is on the board, richest reading first, with a reading for each one whose options give a clean one. A free account opens today’s rows; the rest of the fortnight is what a subscription adds.